In a previous blogpost, I talked about your TPT store data to help create products. This is just one reason why you should be looking at your data monthly. Most of the time, TPT sellers look at their dashboard to view their earnings. However, there are some very important stats being offered to you that can direct what products you should work on and what you should work on next.
Let’s Start With Views!
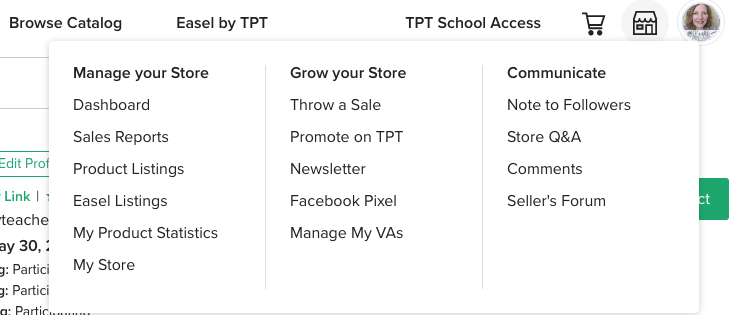
We need to get to your ‘Dashboard’.
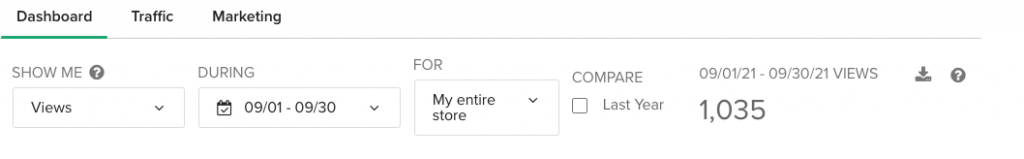
A thousand views for a month is good for me, as I have a small store. But I can compare this TPT Data of the products in my store, to the previous year to see if I’m getting more or less views.
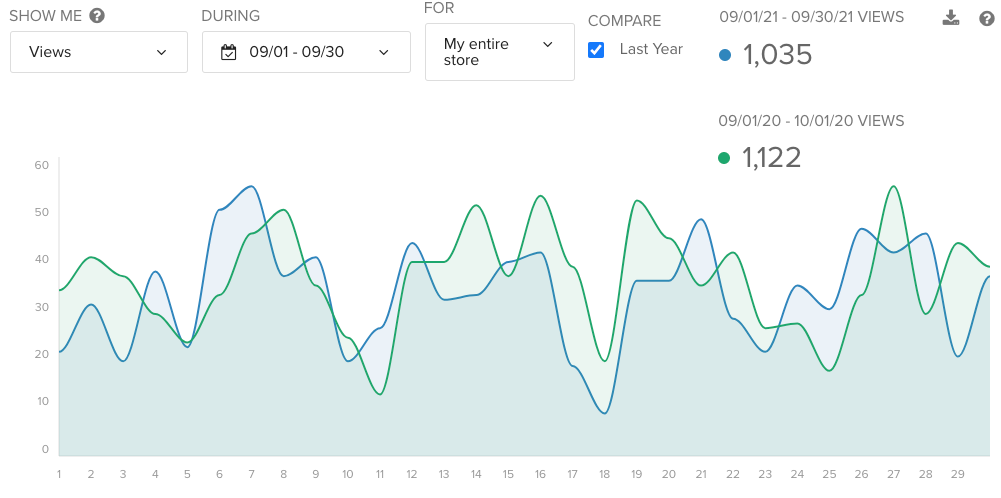
They are pretty much the same. I would love to tell you a number or benchmark to hit when it comes to views but that is next to impossible to answer. There are few TPT sellers that sell in the same niche and have the same products. Visibility is also important. Do you have an online presence somewhere? All these affect your views?
TPT defines views as: it shows how many people viewed the product pages in your store. If you have multiple products selected, it will show the sum of all selected products’ views within the specified date range. Note: This does not include your store homepage, only product pages. View data is only available from February 19th, 2015 onward.
So, views mean someone is looking at YOUR products. That’s good! But did you get a sale, or a download (if it’s a freebie). That is where your conversion rates come in.
Conversion Rates
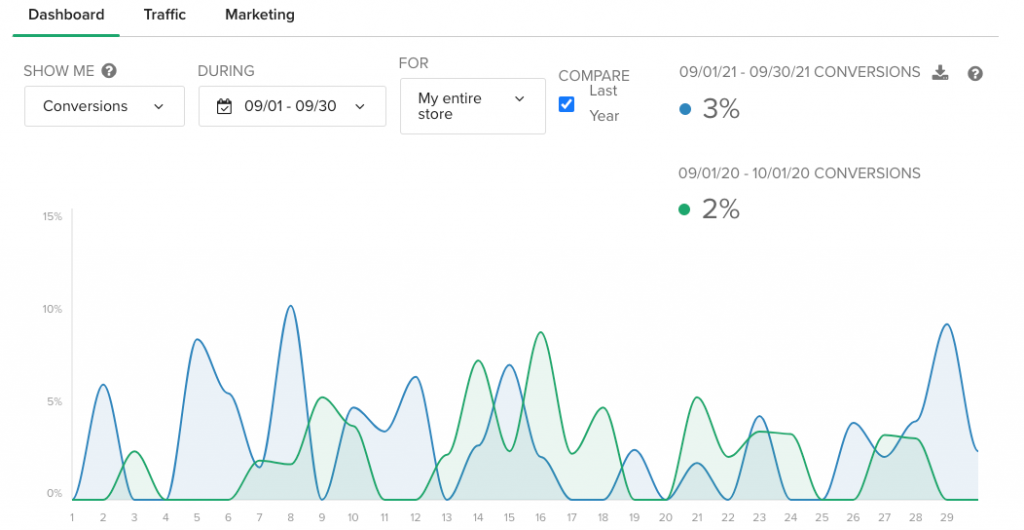
Conversion rate is the percentage of sales based on views. A standard rate is 5%. Looking at mine, what does it mean? It means that my products are not selling themselves. I need to provide more information and give the benefits that would push a buyer to purchase my products.
Take a look at your views and conversion rates. Do you want more views? Make click-worthy covers, talk about the benefits of your products on social media (Instagram, Facebook, Pinterest). Look for ways to bring more visibility to you and your store. If you want higher conversion rates, make sure you have good thumbnails and a pdf preview.
Look at your product descriptions. Are they giving the teacher as much information to make an informed decision?
More TPT Store Data?
There’s more but we’ll continue this into another blog post. If you didn’t read the previous post on Use Your TPT Data to Build Your Store, click the link.
As an aside, are you writing down your monthly data somewhere. I currently have a Google Sheets template for keeping track on your data.
If you have any questions, please do not hesitate to contact me.
In the meantime,
Happy Selling!

Leave a Reply
You must be logged in to post a comment.