Did you know that your TPT data can tell you what to make next? I say this if your store is about 4-6+ months old and your products have been getting some views. Teachers Pay Teachers provides ways for you to see data about your store based on different filters: earnings, views, units sold, conversions, and preview plays. If you create Easel products, they will show you data on those products. Lastly, you can see where your views are coming from, traffic, and that one is especially important!

Your TPT Data Dashboard
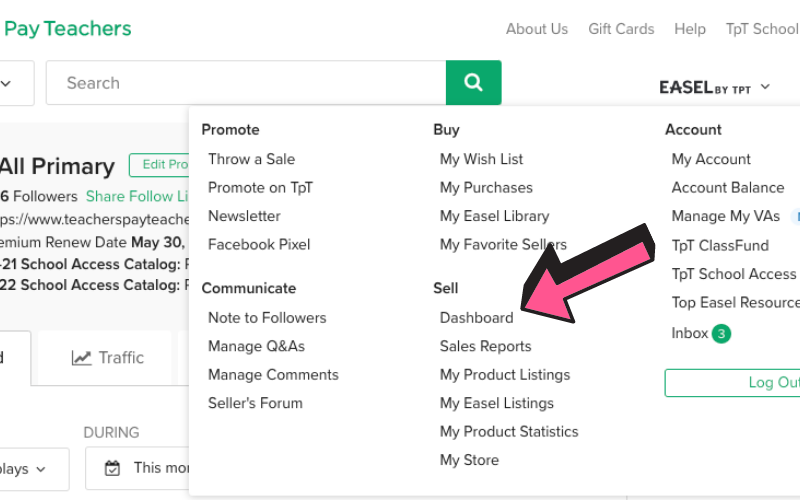
All your data can be found in the dashboard. When you hover over your name (after you signin), your teacher seller menu appears. Here is where you can find the dashboard.
Your TPT Dashboard
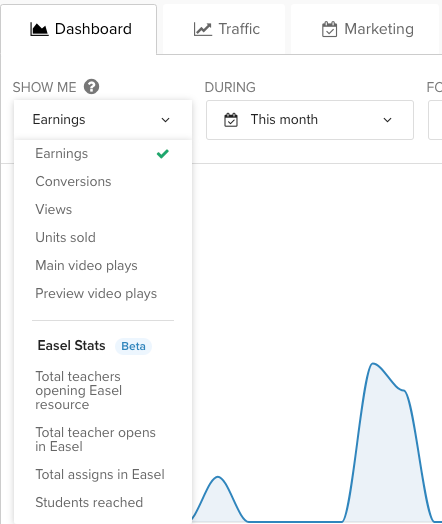
Within your dashboard, you will find data, traffic, creating sales, UTM codes for marketing, and few more items. When you are in your dashboard, the data defaults to earnings, probably because that is what every seller wants know.
Keep track of your monthly earnings. One reason for tax purposes. You are the owner of a business and will need to pay taxes on your business. The second reason is for you! It’s encouraging to see your income grow and if it is not growing, you can look at other data to find out why.
But look at and track the other categories, too! Conversions, views, units solds, preview plays and also very important. Why? Because they will tell you IF your products are getting seen and if they are SEEN, how many are actually buying and WHAT they are buying.
TPT Conversion Rate
The conversion rate is the percentage of buyers that look at your product AND buy it. The higher this number is, the better! However, it can be too high! What does that mean? It usually means you have under priced your product, and everyone is scooping it up. I did this last year. I priced a set of Google Slides (75 slides) for $1. It sold multiple times almost every day for a couple months, but often my earnings were 65¢. The conversion rate was 24%. For a product getting a lot of view, the goal is to price your products so that your conversion rate is between 4-8%. Those Google Slides are still around 13% but I’ve decided to leave it.
That’s the beauty of owning your own store. You decide the products, you decide the price. Many teacher-sellers offer a few $1 items, even though the product is worth much more. If you are starting out, I wouldn’t recommend doing it a lot, maybe 1 or 2. Having a variety of price points makes your store more attractive to buyers.
Units Solds
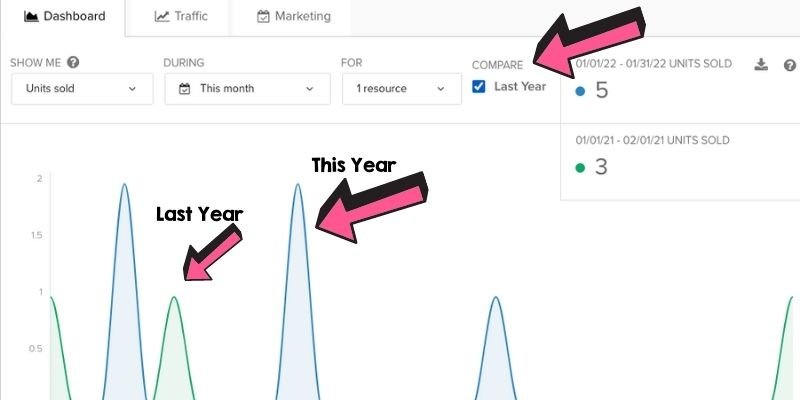
This means how many sales do you have on a product. Let’s go back to my Google Slides. If I look at units sold for the month, and then just highlight the one product. I can see how many it sold. I can go 1 step further by clicking “compare” and it shows me sales for last year at the same time. See below. January is not quite finished so I still may get another sale or two in the last 11 days!
So What Is the TPT Data Telling Me?
By looking at your data, it is telling you whether to make more of the same product, or not. Data tells you whether people are even looking at your data (check your views)!
In the next blog post, we are going to look at ways to get your products seen, especially when your views are low. If you are interested in reading about TPT Data, check out this blog post on deciding between creating seasonal products or evergreen products. Is your top products seasonal or evergreen?
Until then,
Happy Selling!

Leave a Reply
You must be logged in to post a comment.